Key metrics for LLM inference
Before exploring optimization techniques, you need to understand the key metrics they target. Evaluating LLM performance involves using various tools that define, measure, and calculate these metrics differently.
Latency
Latency measures how quickly a model responds to a request. It’s crucial for user experience, especially in interactive, real-time applications.
| Req | TTFT (ms) | E2EL (ms) | Output tokens | TPOT (ms/tok) | SLO | |
|---|---|---|---|---|---|---|
| R1 | 9.71 | ✓ | ||||
| R2 | 8.61 | ✓ | ||||
| R3 | 9.86 | ✗ | ||||
| R4 | 7.41 | ✓ | ||||
| R5 | 9.68 | ✓ | ||||
| R6 | 8.10 | ✗ |
Key metrics to measure latency:
-
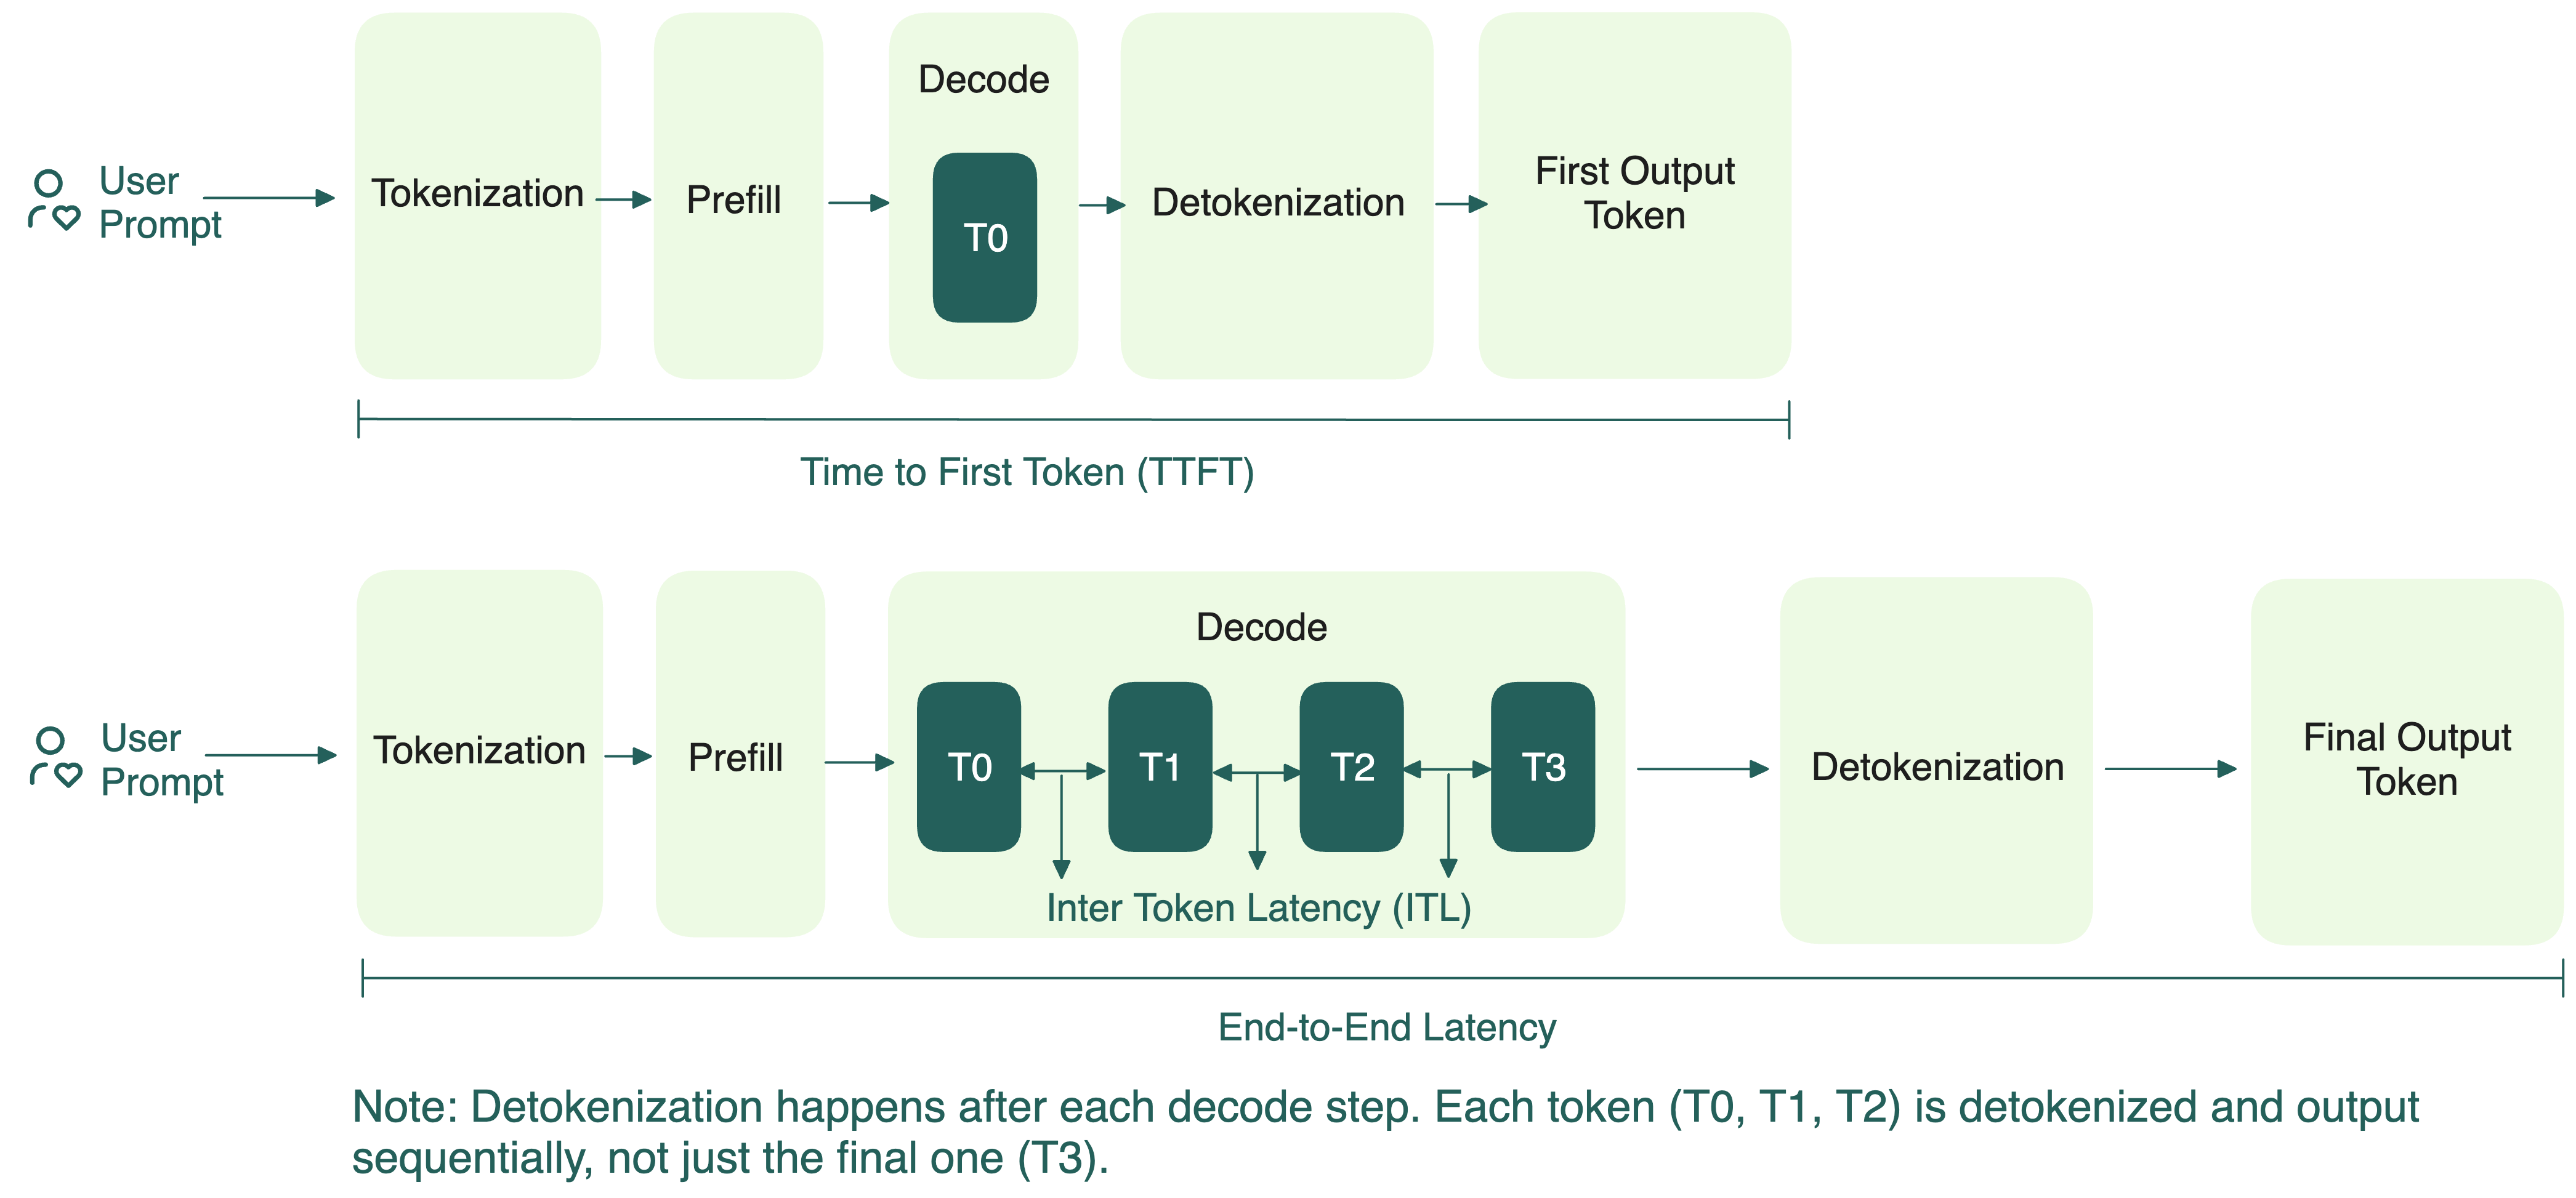
Time to First Token (TTFT): The time it takes to generate the first token after sending a request. It reflects how fast the model can start responding.
-
Total Latency (E2EL): The time from sending the request to receiving the final token on the user end. Total latency directly affects perceived responsiveness. A fast TTFT followed by slow token generation still leads to a poor experience.
-
Token Generation Time: The time it takes to stream all tokens after the first one. TTFT is excluded, since it measures only the steady generation phase:
-
Time per Output Token (TPOT): The average time gap between generating each subsequent token (excluding TTFT). A lower TPOT means the model can produce tokens faster, leading to higher tokens per second. TPOT is usually calculated as follows:
In streaming scenarios where users see text appear word-by-word (like ChatGPT's interface), TPOT determines how smooth the experience feels. The system should ideally keep up with or exceed human reading speed to ensure a smooth experience.
-
Inter-Token Latency (ITL): The exact pause between two consecutive tokens.
For a single request, the mean of all ITLs equals TPOT, which is why the two are sometimes used interchangeably:
Across multiple requests, however, the difference comes down to how you average:
In this case, the average ITL is different from the average TPOT since the latter is usually calculated as follows:
When reading benchmark results, always check how TPOT and ITL are defined. Different frameworks and papers may calculate and use the metrics differently, and this can change how you should interpret performance numbers. In the above equations for multiple requests:
- Average TPOT is request-weighted and is useful when you want to compare per-request latency across systems or configurations. It treats every request equally, regardless of how many tokens are generated.
- Average ITL is token-weighted, so longer responses (which contribute more total tokens) carry more weight. It's better for measuring overall system throughput and steady-state performance (e.g., aggregate streaming speed).
Acceptable latency depends on the use case. For example, a chatbot might require a TTFT under 500 milliseconds to feel responsive, while a code completion tool may need TTFT below 100 milliseconds for seamless developer experience. In contrast, if you're generating long reports that are reviewed once a day, then even a 30-second total latency may be perfectly acceptable. The key is to match latency targets to the pace and expectations of the task at hand.
Understanding mean, median, and P99 latency
When analyzing LLM performance, especially latency, it’s not enough to look at just one number. Metrics like mean, median, and P99 each tell a different part of the story.
-
Mean (Average): This is the sum of all values divided by the number of values. Mean gives a general sense of average performance, but it can be skewed by extreme values (outliers). For example, if the TTFT of one request is unusually slow, it inflates the mean.
-
Median: The middle value when all values are sorted. Median shows the typical user experience. It’s more stable and resistant to outliers than the mean. If your median TTFT is 30 seconds, most users are seeing very slow first responses, which might be unacceptable for real-time use cases.
-
P99 (99th Percentile): The value below which 99% of requests fall. P99 reveals worst-case performance for the slowest 1% of requests. This is important when users expect consistency, or when your SLAs guarantee fast responses for 99% of cases. If your P99 TTFT is nearly 100 seconds, it suggests a small but significant portion of users face very long waits.
noteYou may also see P90 or P95, which show the 90th and 95th percentile latencies, respectively. These are useful for understanding near-worst-case performance and are often used in cases where P99 may be too strict or sensitive to noise.
Together, these metrics give you a complete view:
- Mean helps monitor trends over time.
- Median reflects the experience of the majority of users.
- P99 captures tail latency, which can make or break user experience in production.
You’ll often see these metrics in LLM performance benchmarks, such as mean TTFT, median TPOT, and P99 E2EL, to capture different aspects of latency and user experience.
Throughput
Throughput describes how much work an LLM can do within a given period. High throughput is essential when serving many users simultaneously or processing large volumes of data.
There are two common ways to measure throughput:
-
Requests per Second (RPS): This metric captures how many requests the LLM can successfully complete in one second. It’s calculated as:
Requests per second = Total completed requests / (T1 - T2)noteHere, T1 and T2 mark the time window in seconds.
RPS gives a general sense of how well an LLM handles concurrent requests, but it does not capture the amount of work required by each request. For example, generating a short greeting like
“Hi there!”is far less demanding than writing a long essay. As a result, directly comparing RPS across workloads with different input and output lengths or traffic patterns can be misleading.Factors that impact RPS:
- Prompt complexity and length
- Model size and hardware specifications
- Optimizations (e.g., batching, caching, inference engines)
- Latency per request
-
Tokens per Second (TPS): This metric provides a finer-grained view of throughput by measuring how many tokens are processed every second across all active requests. It comes in two forms:
- Input TPS: How many input tokens the model processes per second.
- Output TPS: How many output tokens the model generates per second.
Understanding both metrics helps you identify performance bottlenecks based on the nature of your inference workload. For example:
- A summarization request that includes long documents (e.g., 2,000-token inputs) cares more about input TPS.
- A chatbot that generates long replies from short prompts (e.g., 20-token prompt → 500-token response) depends heavily on output TPS.
When reviewing benchmarks or evaluating LLM performance, always check whether TPS metrics refer to input, output, or a combined view. They highlight different strengths and limitations depending on the use case.
Factors that impact TPS:
- Batch size (larger batches can increase TPS until saturation)
- KV cache efficiency and memory usage
- Prompt length and generation length
- GPU memory bandwidth and compute utilization
These factors also mean TPS can be easy to misread since it can be gamed. For example:
- A shorter prompt lowers TTFT, which cuts the amount of work each request requires. With less work per request, TPS looks higher than it really is.
- Larger batches and higher concurrency can improve aggregate TPS by keeping the GPU busy, but may increase queueing time, TTFT, or per-user TPOT.
As the number of concurrent requests increases, the total TPS also grows, until the LLM hits the saturation point of available compute resources. Beyond this point, performance might decrease because the LLM is over capacity.
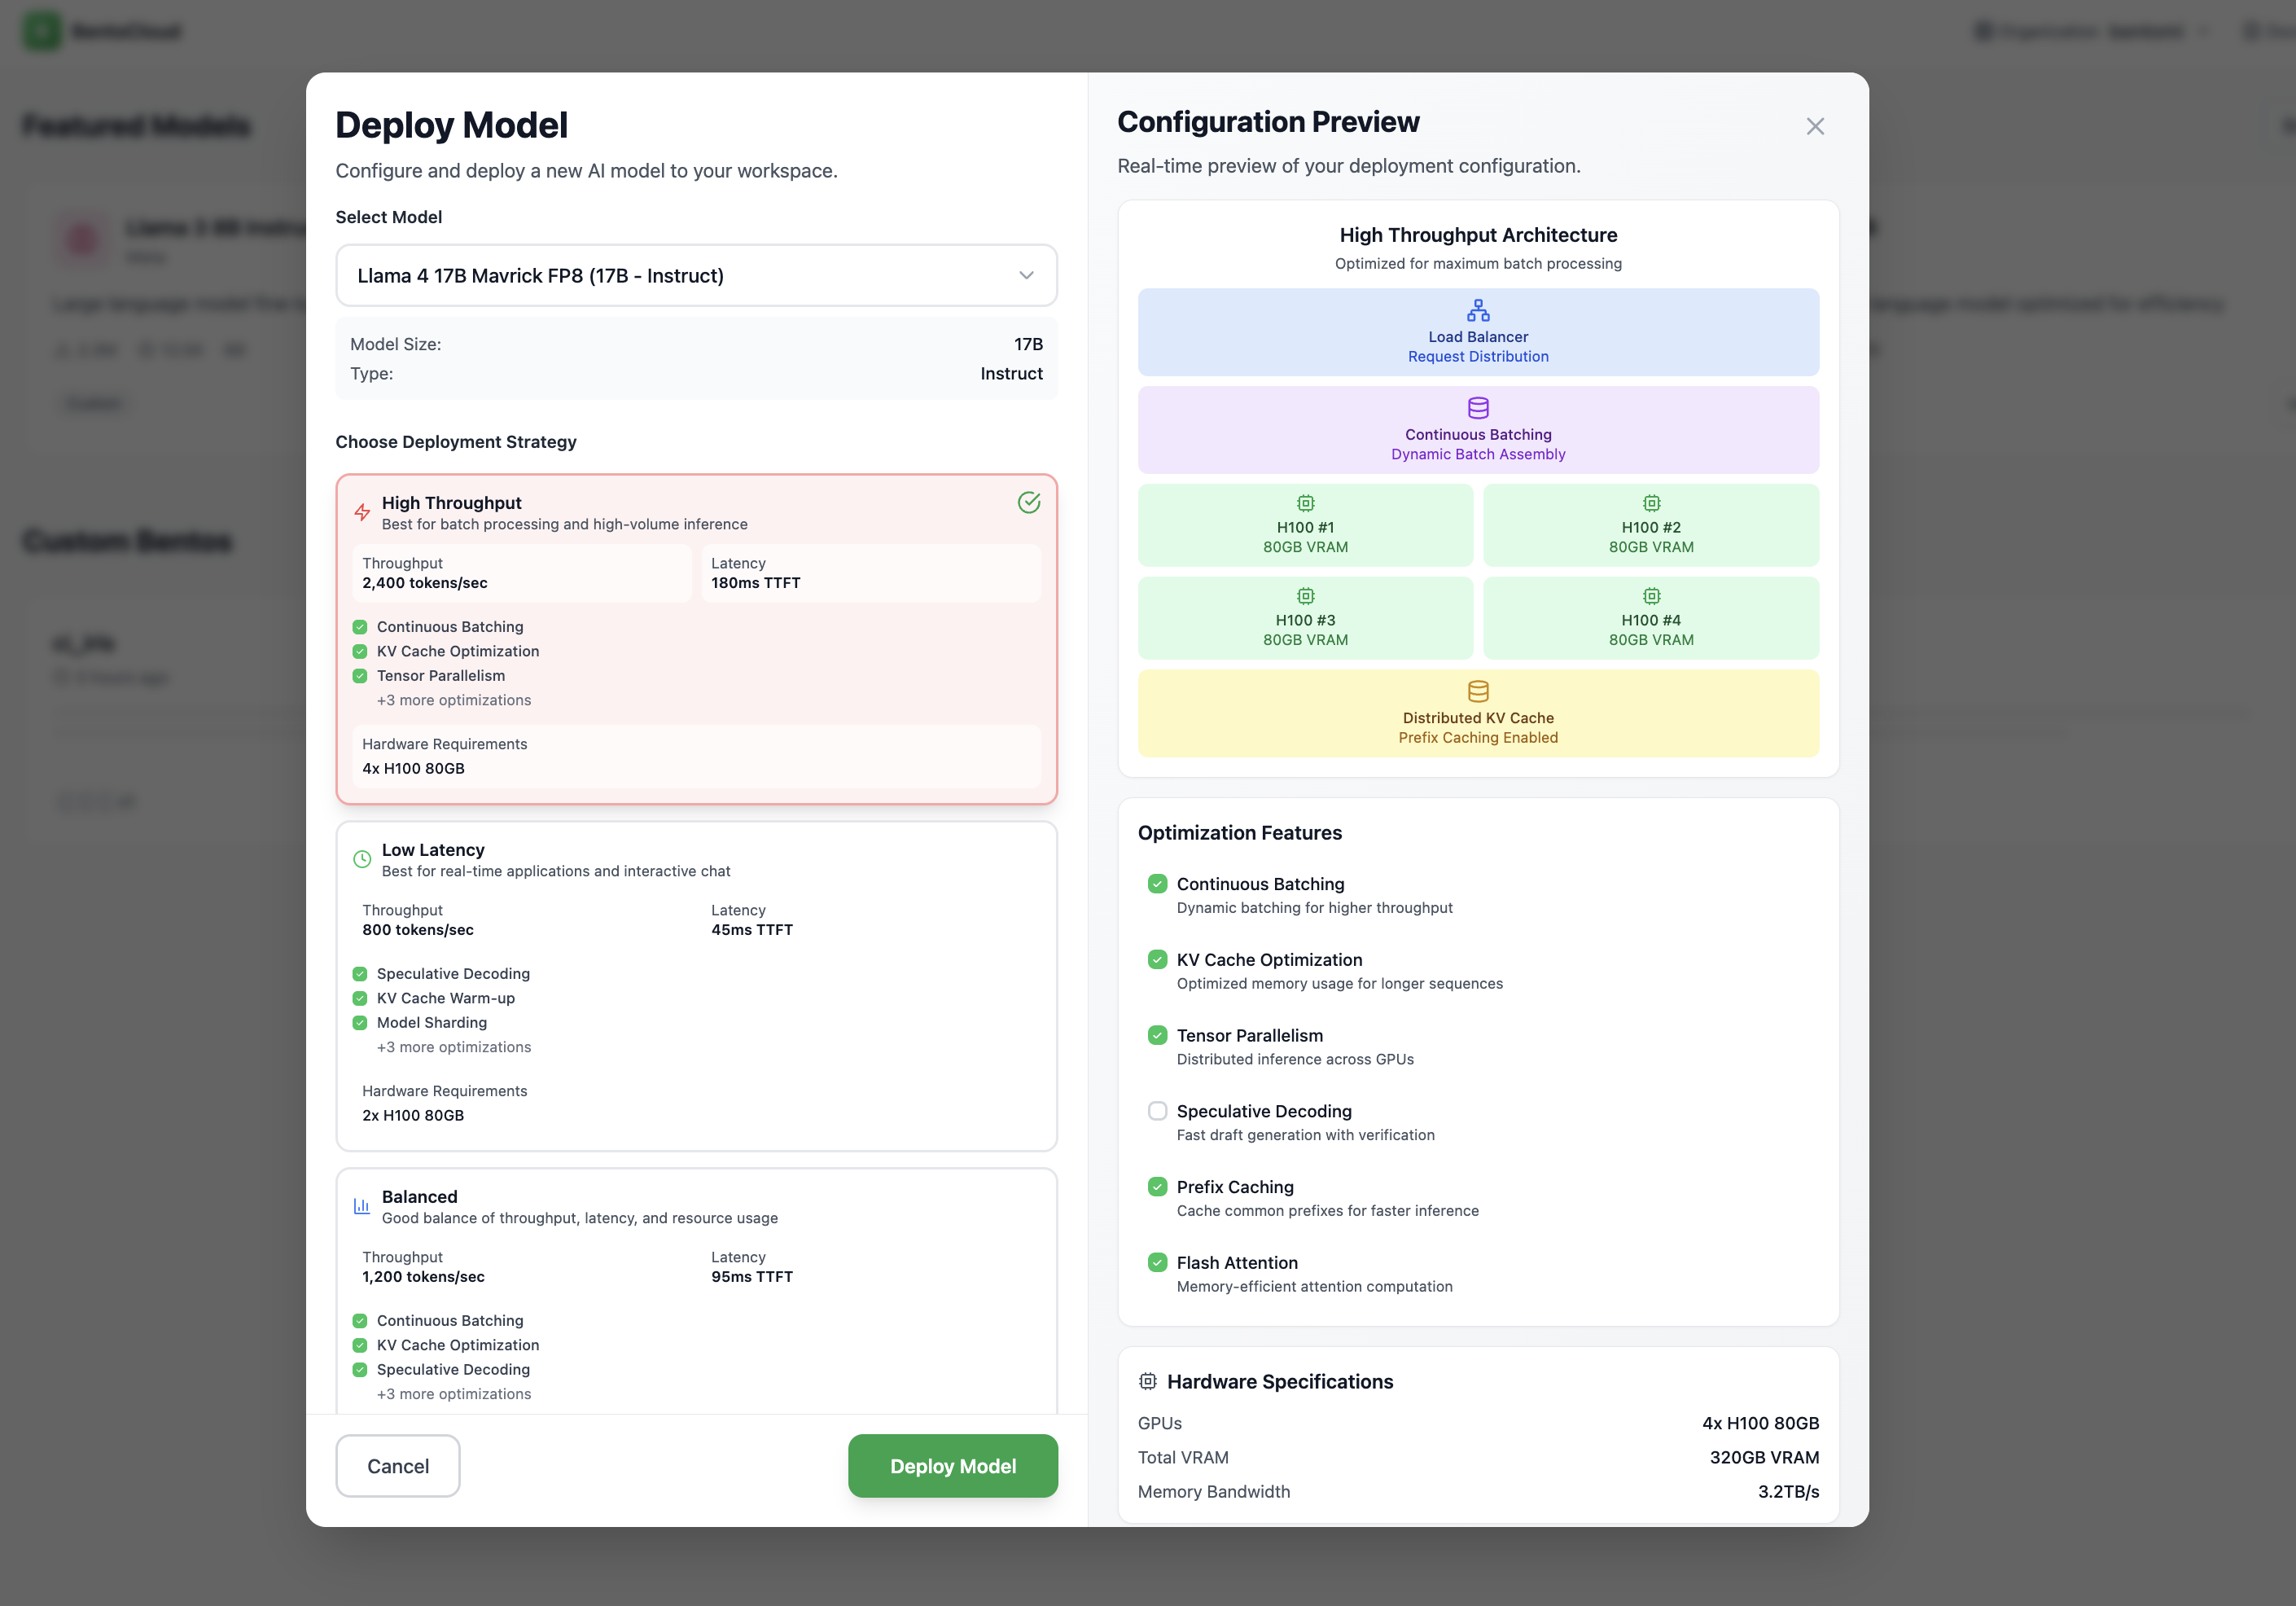
We provide our customers with tailored deployment and inference optimization strategies. You can easily leverage them to optimize for throughput, latency, or cost.
Goodput
Goodput refines the idea of throughput. It measures how many requests per second the LLM successfully completes while meeting your defined service-level objectives (SLOs). This makes it a much more useful metric for real-world deployments, as it directly reflects service quality.
A Service-Level Objective (SLO) defines the target performance level for a particular metric. It sets a standard for what’s considered acceptable service. For example, an SLO for TTFT might specify that 95% of chatbot interactions should have a TTFT below 200 milliseconds. An SLO is typically a key part of a broader service-level agreement (SLA) between a service provider and its users.
Why does goodput matter? A high throughput doesn’t always mean good user experience. If latency targets aren’t met, many of those requests may not be usable. Goodput is a direct measure of how well an LLM serving system meets both performance and user-experience goals under latency constraints. It helps avoid the trap of maximizing throughput at the cost of real user experience and cost-efficiency.
Latency vs. throughput tradeoffs
When hosting and optimizing LLM inference, there’s always a balance between two key goals: minimizing latency and maximizing throughput. Let’s break down what that means.
| Goal | Implication |
|---|---|
| Maximize throughput (TPS/MW) | Focus on serving as many tokens per watt as possible. This usually means using larger batch sizes and shared compute resources. However, it can slow down responses for individual users. |
| Minimize latency (TPS per user) | Focus on giving each user a fast response (low TTFT). This often involves small batches and isolated compute resources, but it means you’ll use GPUs less efficiently. |
| Balance of both | Some systems aim for a dynamic balance. They tune resource usage in real time based on workload, user priority, and app requirements. This is ideal for serving diverse applications with different SLOs. |
The right balance depends on the workload. Different applications experience latency differently, so the metric you prioritize should reflect how users or downstream systems consume the response. Here are some suggestions:
| Use case | Primary metric | Why it matters |
|---|---|---|
| Interactive chat | TTFT, followed by ITL or TPOT | Users care about when the response starts and whether it streams smoothly |
| Long-form streaming | ITL or TPOT and E2EL | Generation speed dominates after the first token |
| Agentic or multi-step workflow | E2EL | Downstream steps usually can't continue until the full response is available |
| High-volume offline processing | TPS and cost per token | Aggregate efficiency matters more than individual request latency |
| Latency-constrained online service | Goodput | Completed requests only count when they meet the latency SLO |
Once you know which metrics matter most, you can tune the system toward the appropriate balance. Important system-level “knobs” include Data Parallelism (DP), Tensor Parallelism (TP), Expert Parallelism (EP), batch size, precision (e.g., FP8, FP4), and disaggregation (separating prefill and decode). Each can improve one part of performance but may add costs elsewhere. The best configuration is the one that meets the SLO of your workload rather than simply delivering the highest throughput or the lowest latency.
Using a serverless API can abstract away these optimizations, leaving you with less control over fine-tuning. On the other hand, building your own programmable and low-level stack lets you navigate these tradeoffs and align your system performance with your app’s specific SLO.
Additional resources
Stay updated with the handbook
Get the latest insights and updates on LLM inference and optimization techniques.
- Monthly insights
- Latest techniques
- Handbook updates